
AT/MT Cam Profiles and ECU Data
The AT and MT versions of the NSX differ not only in their transmissions, but also in their engine cam profiles.
I therefore checked valve lift and valve timing in the Service Manual's Design and Construction section and compared the AT and MT data in the factory JDM ROM. I examined how fueling and ignition timing are calibrated for the different cams.
I also compared this with the factory USDM ROM (ACURA NSX) to see whether the JDM and USDM calibrations differ.
The Service Manual's Design and Construction section clearly lists the differences in valve lift between MT and AT, but duration and overlap must be calculated from the valve timing diagrams provided.
The table below brings these figures together for comparison.
On the low-speed cam profiles, the exhaust profiles are identical, but intake lift is 0.3 mm greater on the AT than on the MT: approximately 3.4% greater for the primary and 3.6% for the secondary.
On the high-speed profiles used when VTEC engages, however, this relationship is reversed. Intake lift is 9.5 mm for the AT versus 10.2 mm for the MT, making the AT lift approximately 6.9% smaller relative to the MT.
Duration is also shorter: 215° for the AT versus 230° for the MT on the intake side, and 215° versus 225° on the exhaust side. Overlap is 0° for the AT versus 10° for the MT.
Thus, while the AT has slightly greater intake lift on the low-speed profiles, the MT has greater lift, duration, and overlap on the high-speed profiles.
Judging from the cam profiles alone, the AT appears to place more emphasis on low-to-mid engine speeds, while the MT appears to favor high engine speeds after VTEC engages.

Valve Timing Diagram
Note: This diagram was created from "Service Manual, Design and Construction, 11-13: Camshaft."
| MT | AT | Difference vs. MT | ||||
|---|---|---|---|---|---|---|
| Intake | Low Speed | Primary | Lift | 8.7 mm | 9.0 mm | +0.3 mm | Duration | 217.5° | 217.5° | 0° | Secondary | Lift | 8.3 mm | 8.6 mm | +0.3 mm | Duration | 217.5° | 217.5° | 0° | High Speed | Mid | Lift | 10.2 mm | 9.5 mm | -0.7 mm | Duration | 230° | 215° | -15° |
| Exhaust | Low Speed | Primary | Lift | 7.7 mm | 7.7 mm | 0 mm | Duration | 212.5° | 212.5° | 0° | Secondary | Lift | 7.4 mm | 7.4 mm | 0 mm | Duration | 212.5° | 212.5° | 0° | High Speed | Mid | Lift | 9.0 mm | 9.0 mm | 0 mm | Duration | 225° | 215° | -10° |
| Overlap | Low Speed | Primary | 15° | 15° | 0° | Secondary | 20° | 20° | 0° | High Speed | Mid | 10° | 0° | -10° |
Note: Duration was calculated by reading the opening and closing angles from the valve timing diagrams in "Service Manual, Design and Construction, 11-13: Camshaft," using "Duration = Opening Angle + 180° + Closing Angle."
The measurement reference may differ from that used for aftermarket cam manufacturers' published duration figures, so the absolute values cannot be compared directly.
Cam specifications alone cannot establish actual engine characteristics. I therefore decided to compare the factory ROM data to examine how the ECU calibrations differ between AT and MT.
I could not find JDM ROM data online, so I purchased it from GRID.
The ROM data I obtained was from AT ECU "37820-PR7-J12." Analysis with TunerPro showed that the AT and MT ECUs use the same ROM image, so I used this data for the comparison.
For the analysis, I used the "Acura_NSX_and_Legend.xdf" definition file available for download from the TunerPro website.
The XDF defines five fuel maps, each consisting of 20×16 cells (320 cells in total).
Fuel Map 1 - Part Throttle
FUEL MAP 1 - Part Throttle
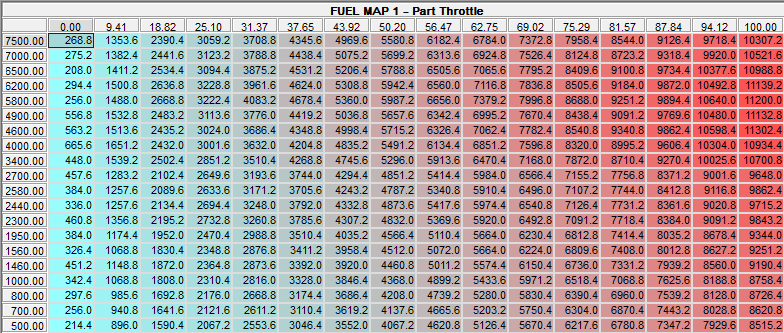
Fuel Map 1 - Part Throttle (MT)
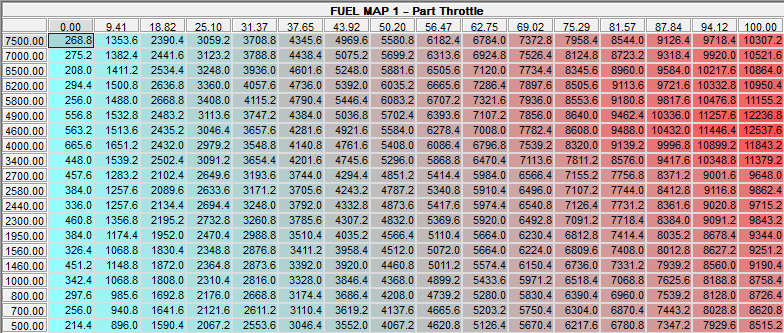
Fuel Map 1 - Part Throttle (AT)
Fuel Map 2 - Part Throttle, EGR Active
FUEL MAP 2 - Part Throttle, EGR Active
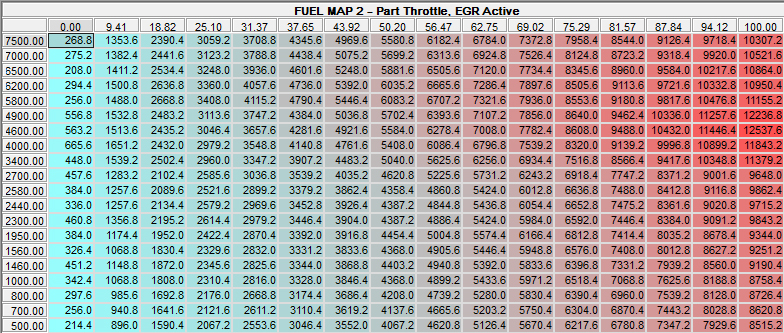
Fuel Map 2 - Part Throttle, EGR (MT)
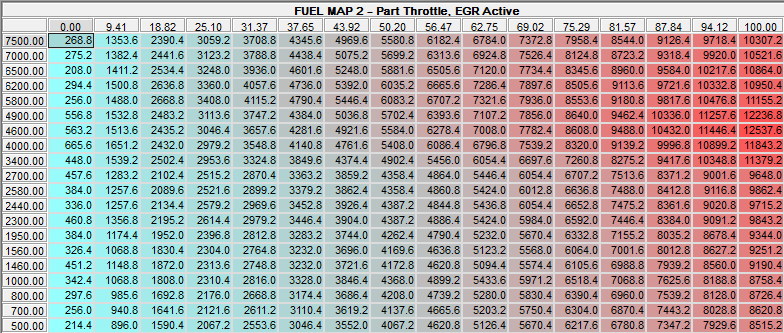
Fuel Map 2 - Part Throttle, EGR (AT)
Fuel Map 3 - High Load / WOT
FUEL MAP 3 - Power Enrichment and WOT
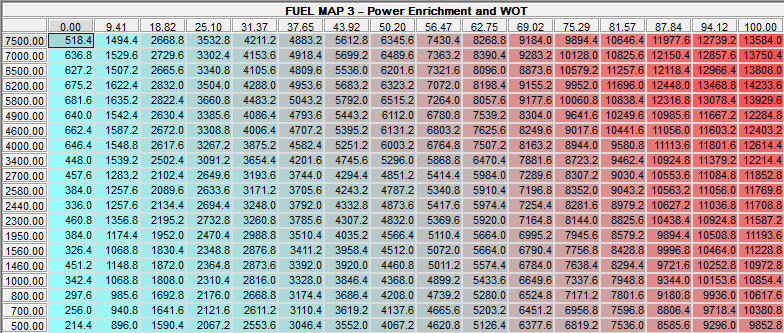
Fuel Map 3 - High Load / WOT (MT)
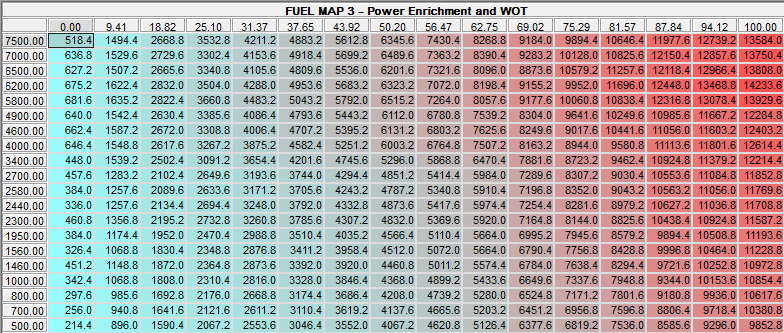
Fuel Map 3 - High Load / WOT (AT)
Fuel Map 4 - Part Throttle, VTEC Active
FUEL MAP 4 - Part Throttle, VTEC Active
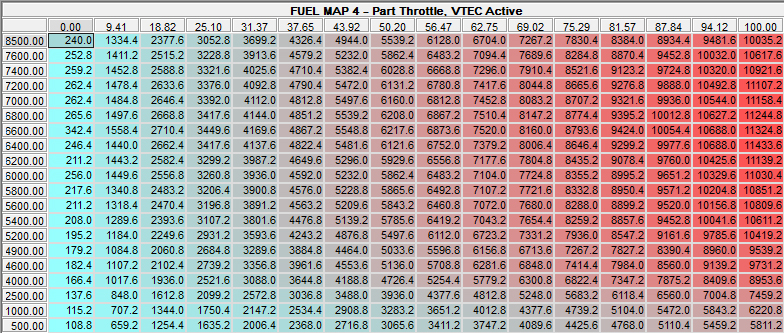
Fuel Map 4 - Part Throttle, VTEC (MT)
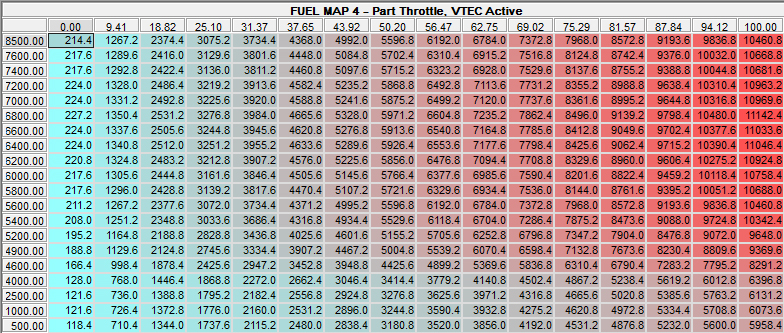
Fuel Map 4 - Part Throttle, VTEC (AT)
Fuel Map 5 - High Load / WOT, VTEC Active
FUEL MAP 5 - Power Enrichment and WOT, VTEC Active
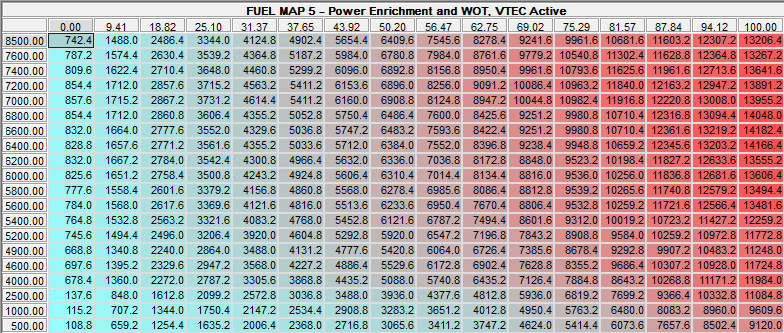
Fuel Map 5 - High Load / WOT, VTEC (MT)
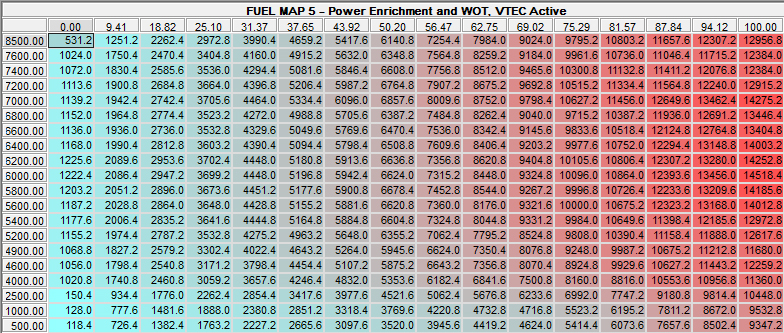
Fuel Map 5 - High Load / WOT, VTEC (AT)
AT vs. MT Fuel Map Differences
Comparing the AT and MT data reveals some differences in "FUEL MAP 1" and "FUEL MAP 2" even with VTEC inactive. There are 82 differing cells in "FUEL MAP 1" and 50 in "FUEL MAP 2," used when EGR is active.
The differences increase substantially with VTEC active: 315/320 cells differ in the part-throttle "FUEL MAP 4," and 313/320 differ in the high-load/WOT "FUEL MAP 5."
In other words, with VTEC active, the AT and MT fuel map values differ in almost every cell, regardless of load.
This seems likely to be related to the substantial differences in high-speed cam lift, duration, and overlap.
The exception is "FUEL MAP 3," used under high load and at wide-open throttle with VTEC inactive.
Although the AT's low-speed intake cam lift is 0.3 mm greater than the MT's, all 320 cells in "FUEL MAP 3" are identical between AT and MT.
By contrast, the part-throttle "FUEL MAP 1" and "FUEL MAP 2" show some differences between AT and MT.
Given that "FUEL MAP 3," which also operates on the low-speed cams, is identical, the differences in "FUEL MAP 1" and "FUEL MAP 2" cannot be explained by cam profiles alone. Differences in operating conditions during normal driving may also be reflected in the calibrations.
| Fuel Map | Definition | Description | Differing Cells | Difference Rate |
|---|---|---|---|---|
| FUEL MAP 1 | FUEL MAP1 Part Throttle | Part Throttle | 82 / 320 | 25.6% |
| FUEL MAP 2 | Part Throttle, EGR Active | Part Throttle, EGR Active | 50 / 320 | 15.6% |
| FUEL MAP 3 | Power Enrichment and WOT | High Load / WOT | 0 / 320 | 0% |
| FUEL MAP 4 | Part Throttle, VTEC Active | Part Throttle, VTEC Active | 315 / 320 | 98.4% |
| FUEL MAP 5 | Power Enrichment and WOT, VTEC Active | High Load / WOT, VTEC Active | 313 / 320 | 97.8% |
Comparing the Full VTEC Fuel Map
I compared all 320 cells in "FUEL MAP 5 - Power Enrichment and WOT, VTEC Active" for the JDM AT and MT versions. This map has 20 engine-speed breakpoints and 16 load breakpoints ranging from 0 to 100%. The table below shows the MT map values minus the AT map values.
Note: The table shows fuel map value differences calculated as "MT − AT." Negative values mean the AT map value is larger, and positive values mean the MT map value is larger. The table also includes cells at engine speeds where VTEC is inactive.
| rpm | 0.0% | 9.4% | 18.8% | 25.1% | 31.4% | 37.6% | 43.9% | 50.2% | 56.5% | 62.7% | 69.0% | 75.3% | 81.6% | 87.8% | 94.1% | 100% |
|---|---|---|---|---|---|---|---|---|---|---|---|---|---|---|---|---|
| 500 | -9.6 | -67.2 | -128.0 | -128.0 | -220.8 | -297.6 | -380.8 | -454.4 | -534.4 | -672.0 | 0.0 | 0.0 | 0.0 | 0.0 | 0.0 | -227.2 |
| 1000 | -12.8 | -70.4 | -137.6 | -137.6 | -233.6 | -316.8 | -409.6 | -486.4 | -569.6 | -720.0 | +233.6 | +240.0 | +284.8 | +272.0 | +288.0 | +76.8 |
| 2500 | -12.8 | -86.4 | -163.2 | -163.2 | -281.6 | -380.8 | -489.6 | -585.6 | -684.8 | -864.0 | -297.6 | -172.8 | -48.0 | +185.6 | +518.4 | +636.8 |
| 4000 | -342.4 | -380.8 | -188.8 | -272.0 | -352.0 | -377.6 | -396.8 | -265.6 | -441.6 | -406.4 | -374.4 | -275.2 | -172.8 | -284.8 | +214.4 | +624.0 |
| 4600 | -358.4 | -403.2 | -211.2 | -224.0 | -230.4 | -227.2 | -220.8 | -345.6 | -470.4 | -454.4 | -441.6 | -569.6 | -243.2 | -320.0 | -515.2 | -534.4 |
| 4900 | -400.0 | -486.4 | -339.2 | -438.4 | -534.4 | -512.0 | -486.4 | -524.8 | -560.0 | -624.0 | -691.2 | -569.6 | -694.4 | -768.0 | -729.6 | -432.0 |
| 5200 | -409.6 | -480.0 | -291.2 | -326.4 | -355.2 | -358.4 | -355.2 | -435.2 | -515.2 | -598.4 | -681.6 | -899.2 | -806.4 | -899.2 | -915.2 | -844.8 |
| 5400 | -412.8 | -473.6 | -272.0 | -320.0 | -361.6 | -396.8 | -432.0 | -483.2 | -537.6 | -550.4 | -729.6 | -672.0 | -630.4 | -675.2 | -758.4 | -713.6 |
| 5600 | -403.2 | -460.8 | -246.4 | -278.4 | -307.2 | -339.2 | -368.0 | -387.2 | -409.6 | -505.6 | -515.2 | -467.2 | -416.0 | -601.6 | -601.6 | -531.2 |
| 5800 | -425.6 | -492.8 | -294.4 | -294.4 | -294.4 | -316.8 | -332.8 | -400.0 | -467.2 | -457.6 | -454.4 | -457.6 | -460.8 | -492.8 | -630.4 | -691.2 |
| 6000 | -396.8 | -435.2 | -188.8 | -198.4 | -204.8 | -272.0 | -336.0 | -313.6 | -300.8 | -313.6 | -508.8 | -560.0 | -608.0 | -556.8 | -774.4 | -912.0 |
| 6200 | -393.6 | -422.4 | -169.6 | -160.0 | -147.2 | -214.4 | -281.6 | -300.8 | -320.0 | -448.0 | -556.8 | -582.4 | -608.0 | -480.0 | -646.4 | -697.6 |
| 6400 | -339.2 | -332.8 | -41.6 | -41.6 | -35.2 | -60.8 | -86.4 | -124.8 | -57.6 | -9.6 | +35.2 | -28.8 | -92.8 | +51.2 | +54.4 | +163.2 |
| 6600 | -304.0 | -272.0 | +41.6 | +19.2 | 0.0 | -12.8 | -22.4 | +12.8 | +57.6 | +80.0 | +105.6 | +147.2 | +192.0 | +236.8 | +454.4 | +777.6 |
| 6800 | -297.6 | -252.8 | +86.4 | +83.2 | +83.2 | +64.0 | +44.8 | +99.2 | +115.2 | +163.2 | +211.2 | +265.6 | +323.2 | +380.8 | +403.2 | +601.6 |
| 7000 | -281.6 | -227.2 | +124.8 | +25.6 | +150.4 | +76.8 | +64.0 | +51.2 | +115.2 | +195.2 | +246.4 | +355.2 | +460.8 | -428.8 | -454.4 | -320.0 |
| 7200 | -259.2 | -188.8 | +172.8 | +51.2 | +166.4 | +204.8 | +166.4 | +131.2 | +348.8 | +416.0 | +393.6 | +448.0 | +505.6 | +598.4 | +707.2 | +976.0 |
| 7400 | -262.4 | -208.0 | +124.8 | +112.0 | +166.4 | +217.6 | +249.6 | +284.8 | +400.0 | +438.4 | +496.0 | +492.8 | +492.8 | +550.4 | +636.8 | +1257.6 |
| 7600 | -236.8 | -176.0 | +160.0 | +134.4 | +204.8 | +272.0 | +352.0 | +432.0 | +419.2 | +502.4 | +595.2 | +579.2 | +566.4 | +582.4 | +649.6 | +883.2 |
| 8500 | +211.2 | +236.8 | +224.0 | +371.2 | +134.4 | +243.2 | +236.8 | +268.8 | +291.2 | +294.4 | +217.6 | +166.4 | -121.6 | -54.4 | 0.0 | +249.6 |
AT/MT Differences by Load and RPM
Overall, at high load, the AT map values tend to be larger at mid-range engine speeds, while the MT values tend to be larger at high engine speeds. At low load, many cells have larger AT values; at 0% load between 4,000 and 6,200 rpm, the MT values are approximately 30% or more smaller. However, this is a ratio of map values and does not mean that the actual fuel injection quantity differs by the same proportion while driving.
At the high-load breakpoints of 87.8%, 94.1%, and 100%, the AT values are consistently larger from 4,600 to 6,200 rpm. At 5,200 rpm, the average difference across these three columns is approximately 7.5%. The difference nearly disappears around 6,400 rpm, and the MT values become approximately 4% larger on average from 6,600 to 6,800 rpm. Although the AT values briefly become larger at 7,000 rpm, the MT values are again approximately 6–7% larger on average from 7,200 to 7,600 rpm.
Note: Differences in map values cannot be interpreted directly as differences in intake airflow, torque, or power output.
| Range | Cam Profile | FUEL MAP 5 Trend |
|---|---|---|
| 4600~6200rpm | AT high-speed cams: lower lift, shorter duration | AT map values approximately 4–8% larger |
| Around 6400 rpm | - | Approximately equal |
| 6600~6800rpm | MT high-speed cams: higher lift, longer duration | MT values approximately 4% larger |
| 7000rpm | - | AT values approximately 3% larger |
| 7200~7600rpm | MT high-speed cams favor high rpm | MT values approximately 6–7% larger |
Next, I compared ignition timing.
The XDF defines three ignition timing maps. Like the fuel maps, each consists of 20×16 cells (320 cells in total).
Ignition Table 1 - Main
Ignition Timing Table 1 Main
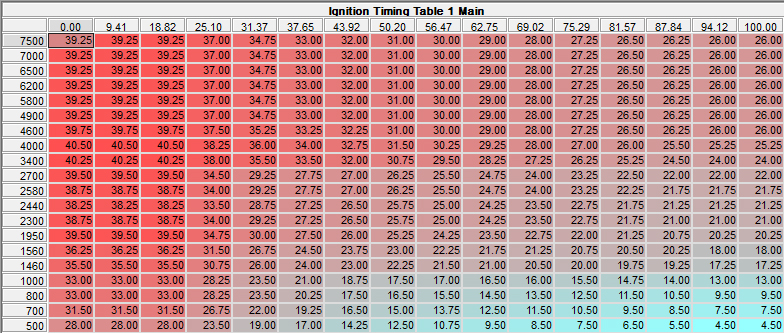
Ignition Table 1 - Main (MT)
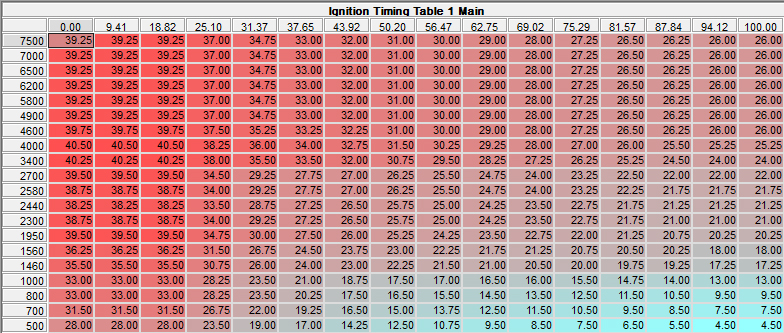
Ignition Table 1 - Main (AT)
Ignition Table 2 - EGR Active
Ignition Timing Table 2 EGR Active
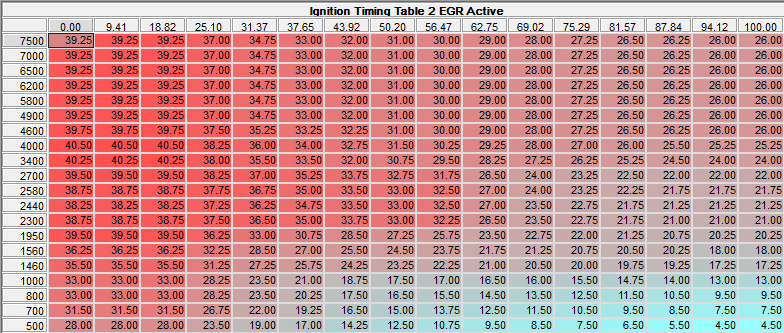
Ignition Table 2 - EGR Active (MT)
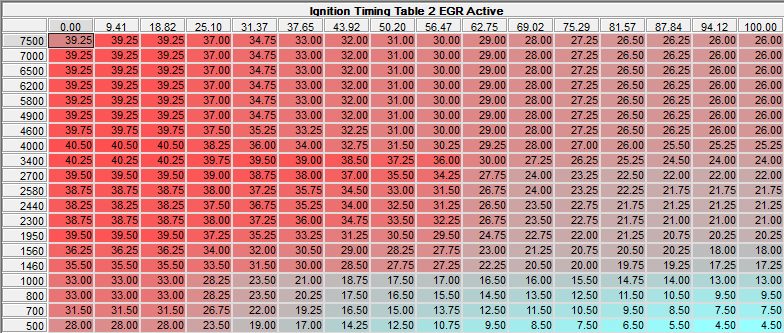
Ignition Table 2 - EGR Active (AT)
Ignition Table 3 - VTEC Active
Ignition Timing Table 3 VTEC Active
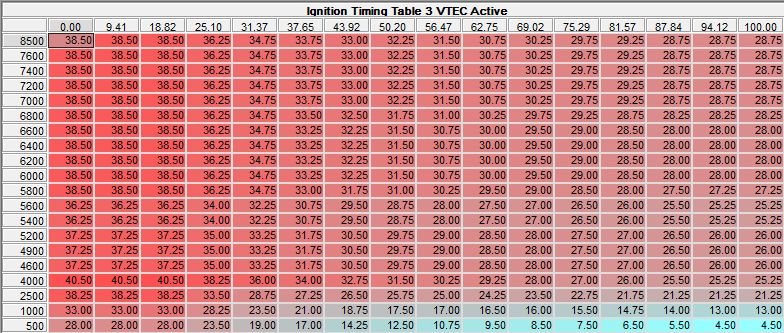
Ignition Table 3 - VTEC Active (MT)
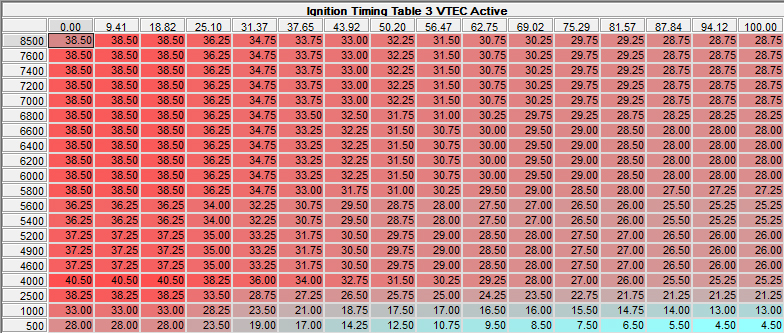
Ignition Table 3 - VTEC Active (AT)
Ignition Differences Only with EGR
Comparing the AT and MT ignition timing tables, all 320 cells match in both the normal-operation table (Ignition Timing Table 1) and the VTEC-active table (Ignition Timing Table 3).
In contrast, the EGR-active table (Ignition Timing Table 2) differs in 54 cells spanning 1,460–3,400 rpm and approximately 25–63% load.
Although the VTEC cam profiles differ substantially between AT and MT, the ignition timing table used with VTEC active is shared.
The differences occur at low-to-mid engine speeds with the throttle partially open. These may be adjustments to suit the cruising conditions of the AT and MT versions. In the tables compared here, all other ignition timing settings were shared.
| Ignition Timing Map | Definition | Description | Differing Cells |
|---|---|---|---|
| Ignition Timing Table 1 | Main | Normal Operation | 0 / 320 |
| Ignition Timing Table 2 | EGR Active | EGR Active | 54 / 320 |
| Ignition Timing Table 3 | VTEC Active | VTEC Active | 0 / 320 |
All Compared Fuel Maps Match
I compared the JDM and USDM fuel maps using "NSX91M OEM.bin," obtained from NSX Prime. All 320 cells in each of FUEL MAP 1–5 matched for both MT and AT.
The USDM version differs in gear ratios, fuel used, and other respects, but these differences are not reflected in the fuel map values compared here.
Even the mid-range VTEC-active region that differed between AT and MT had identical values between JDM and USDM.
| Fuel Map | MT | AT |
|---|---|---|
| FUEL MAP 1 | 0 / 320 | 0 / 320 |
| FUEL MAP 2 | 0 / 320 | 0 / 320 |
| FUEL MAP 3 | 0 / 320 | 0 / 320 |
| FUEL MAP 4 | 0 / 320 | 0 / 320 |
| FUEL MAP 5 | 0 / 320 | 0 / 320 |
Ignition Maps Differ Substantially
In contrast to the fuel maps, the ignition timing maps differ substantially.
In particular, the VTEC "Ignition Timing Table 3" differs between JDM and USDM in 242/320 cells (75.6%) for MT and 245/320 cells (76.6%) for AT.
While all five fuel maps match exactly, much of the ignition timing maps has been changed.
| Ignition Timing Map | MT Differences | AT Differences |
|---|---|---|
| Table 1 Main | 227 / 320 | 227 / 320 |
| Table 2 EGR Active | 199 / 320 | 189 / 320 |
| Table 3 VTEC Active | 242 / 320 | 245 / 320 |
In the JDM versions, all 320 cells in the VTEC-active ignition timing table match between AT and MT, despite their different VTEC cam profiles. In the USDM versions, 29 cells in this table differ, showing that some VTEC-active ignition timing values are different between AT and MT.
| Market | AT vs. MT Differences |
|---|---|
| JDM | 0 / 320 |
| USDM | 29 / 320 |
VTEC-Active Ignition Differences
I compared the VTEC-active ignition timing table (Ignition Timing Table 3) for JDM and USDM MT cars.
The JDM version has more ignition advance toward the high-load end. At 100% load from 4,600 to 7,600 rpm, it has 3.50–5.75° more advance than the USDM version at every engine speed.
However, at low and medium loads from 4,600 to 5,600 rpm, some cells have more advance in the USDM version. Which version has more advance therefore depends on load.
Note: The table values are calculated as "JDM ignition timing − USDM ignition timing." Positive values indicate that the JDM version has more advance.
| rpm | 0.0% | 9.4% | 18.8% | 25.1% | 31.4% | 37.6% | 43.9% | 50.2% | 56.5% | 62.7% | 69.0% | 75.3% | 81.6% | 87.8% | 94.1% | 100% |
|---|---|---|---|---|---|---|---|---|---|---|---|---|---|---|---|---|
| 500 | 0.00° | 0.00° | 0.00° | 0.00° | 0.00° | 0.00° | 0.00° | -0.50° | -0.75° | -1.25° | -1.00° | 0.00° | +1.50° | +2.75° | +3.50° | +3.50° |
| 1000 | 0.00° | 0.00° | 0.00° | 0.00° | 0.00° | 0.00° | 0.00° | +0.50° | +1.75° | +1.75° | +1.75° | +3.00° | +3.75° | +5.25° | +5.25° | +6.75° |
| 2500 | -0.50° | -0.50° | -0.50° | -0.50° | -0.50° | 0.00° | +1.25° | +1.50° | +2.00° | +2.00° | +2.00° | +1.75° | +1.25° | +1.75° | +2.75° | +4.25° |
| 4000 | 0.00° | 0.00° | 0.00° | +0.25° | -0.25° | -0.25° | -0.25° | 0.00° | +0.25° | +0.50° | +0.25° | 0.00° | +0.25° | +1.75° | +2.00° | +3.50° |
| 4600 | -2.50° | -2.50° | -2.50° | -2.50° | -2.25° | -2.00° | -1.75° | -1.25° | -1.00° | -0.50° | 0.00° | +0.25° | +0.50° | +2.75° | +2.75° | +4.25° |
| 4900 | -2.00° | -2.00° | -2.00° | -2.00° | -1.75° | -1.50° | -1.25° | -0.75° | -0.50° | -0.25° | +0.25° | +0.25° | +0.50° | +2.75° | +2.75° | +4.25° |
| 5200 | -1.25° | -1.25° | -1.25° | -1.00° | -1.00° | -0.75° | -0.50° | 0.00° | +0.25° | +0.50° | +0.75° | +1.00° | +0.75° | +2.75° | +2.75° | +4.25° |
| 5400 | -2.25° | -2.25° | -2.25° | -2.00° | -2.00° | -1.75° | -1.50° | -1.00° | -0.75° | -0.50° | -0.25° | 0.00° | -0.25° | +1.75° | +2.00° | +3.50° |
| 5600 | -2.25° | -2.25° | -2.25° | -2.00° | -2.00° | -1.75° | -1.50° | -1.00° | -0.75° | -0.50° | -0.25° | 0.00° | -0.25° | +1.75° | +2.00° | +3.50° |
| 5800 | 0.00° | 0.00° | 0.00° | +0.25° | +0.50° | +0.50° | +0.75° | +1.25° | +1.50° | +1.50° | +1.75° | +2.00° | +1.75° | +3.75° | +4.00° | +5.50° |
| 6000 | 0.00° | 0.00° | 0.00° | +0.25° | +0.50° | +0.75° | +1.25° | +1.25° | +1.25° | +1.00° | +1.25° | +1.25° | +1.00° | +2.75° | +3.25° | +4.25° |
| 6200 | 0.00° | 0.00° | 0.00° | +0.25° | +0.50° | +0.75° | +1.00° | +1.00° | +0.75° | +0.50° | +0.25° | +0.25° | 0.00° | 0.00° | +1.50° | +5.00° |
| 6400 | 0.00° | 0.00° | 0.00° | 0.00° | +0.50° | +0.75° | +1.00° | +0.75° | +0.50° | 0.00° | -0.25° | -0.50° | -0.75° | 0.00° | +1.50° | +5.00° |
| 6600 | 0.00° | 0.00° | 0.00° | 0.00° | +0.50° | +0.75° | +1.00° | +0.75° | +0.50° | 0.00° | -0.25° | -0.50° | -0.75° | 0.00° | +1.50° | +5.00° |
| 6800 | 0.00° | 0.00° | 0.00° | 0.00° | +0.50° | +1.00° | +1.25° | +1.00° | +0.75° | +0.25° | 0.00° | -0.25° | -0.50° | +0.25° | +1.75° | +5.25° |
| 7000 | 0.00° | 0.00° | 0.00° | 0.00° | +0.50° | +1.25° | +1.75° | +1.50° | +1.25° | +0.75° | +0.50° | +0.25° | 0.00° | +0.75° | +2.25° | +5.75° |
| 7200 | 0.00° | 0.00° | 0.00° | 0.00° | +0.50° | +1.25° | +1.75° | +1.50° | +1.25° | +0.75° | +0.50° | +0.25° | 0.00° | +0.75° | +2.25° | +5.75° |
| 7400 | 0.00° | 0.00° | 0.00° | 0.00° | +0.50° | +1.25° | +1.75° | +1.50° | +1.25° | +0.75° | +0.50° | +0.25° | 0.00° | +0.75° | +2.25° | +5.75° |
| 7600 | 0.00° | 0.00° | 0.00° | 0.00° | +0.50° | +1.25° | +1.75° | +1.50° | +1.25° | +0.75° | +0.50° | +0.25° | 0.00° | +0.75° | +2.25° | +5.75° |
| 8500 | 0.00° | 0.00° | 0.00° | 0.00° | +0.50° | +1.25° | +1.75° | +1.50° | +1.25° | +0.75° | +0.50° | +0.25° | 0.00° | +0.75° | +2.25° | +5.75° |
Possible Link to Octane Rating
These results suggest a possible difference in the fuel expected for the JDM and USDM versions.
In general, higher-octane fuel that is less prone to knock allows ignition timing to be advanced more readily within the knock-free range.
This ROM analysis found identical JDM and USDM fuel maps but substantial differences in ignition maps. In particular, JDM ignition timing is considerably more advanced at high load with VTEC active.
These differences may be related to the octane ratings of the fuel expected for each version.
However, comparing ROM data alone does not reveal why the calibrations differ.
Fuel octane rating provides one clue when considering the ignition timing differences.
This analysis alone cannot establish Honda's reasons for changing the calibrations, including factors other than fuel.
Note: The possible link to octane rating is an interpretation of the ROM analysis results. I have not verified any documentation in which Honda explains the reasons for these calibrations. Other differences between JDM and USDM, such as emissions regulations, certification requirements, and fuel composition, may also play a role.
| Item / Engine-Speed Range | AT | MT |
|---|---|---|
| Non-VTEC Intake Lift | 0.3 mm greater than MT | 0.3 mm less than AT |
| Non-VTEC WOT Fuel | Same as MT | Same as AT |
| Main Ignition Timing | Same as MT | Same as AT |
| VTEC Intake Lift | 9.5mm | 10.2mm |
| VTEC Intake Duration | 215° | 230° |
| VTEC Exhaust Duration | 215° | 225° |
| VTEC Overlap | 0° | 10° |
| VTEC Fuel 4600~6200rpm | Relatively Larger | Relatively Smaller |
| VTEC Fuel 7200~7600rpm | Relatively Smaller | Relatively Larger |
| JDM VTEC Ignition Timing | Same as MT | Same as AT |
| Rev Limit Settings | Includes settings for 7500 rpm | Includes settings for 8000 rpm |
Now consider these findings for a car converted from AT to MT. Even with an AT engine paired with an MT ECU, the non-VTEC WOT fuel map and normal-operation ignition map are shared, so the AT and MT map values do not differ in this region.
Once VTEC engages, however, the MT Fuel Maps 4/5 are used with the AT high-speed cams.
In the JDM versions, the VTEC-active ignition map is also shared. Thus, among the main maps examined here, the clearest difference is in the VTEC-active fuel maps.
It is also important to note that using an MT ECU while retaining the AT valve springs allows the engine to rev beyond the AT setting of 7500 rpm up to the MT rev limit.
Considering the cam profiles and fuel maps together also reveals differences in AT/MT engine characteristics.
The AT cams have slightly greater low-speed intake lift than the MT cams, but less lift, duration, and overlap with VTEC active.
The fuel maps show a corresponding pattern: after VTEC engages, the AT values are larger from 4600 to 6200 rpm, while the MT values are larger at 7200 rpm and above.
This suggests that the AT specification favors the mid-range after VTEC engages, while the MT specification places more emphasis on higher engine speeds.
It is interesting that both the cam profiles and fuel maps show these trends. However, map values alone cannot establish the actual differences in torque or power output.